Creating The Perfect Activation Metric
or, Did It Really Need To Be This Complex?
At Prefect, activation metrics measure user engagement with the product at both individual and aggregate levels. These serve multiple purposes: identifying engaged users, spotting early adoption opportunities, tracking user journeys, and informing growth strategy decisions.
Why use an activation metric?
When I first joined Prefect, understanding individual customer progress required reviewing multiple disparate metrics across dashboards. We sought a simplified measure to assess user adoption and identify which customers needed further nurturing versus those ready for engagement.
When activation matters
Prefect operates as a product-led growth company with open-source offerings and a free tier. Most paying customers never interact with sales teams. This model inverts traditional Enterprise SaaS approaches — the product is the sales rep, and product usage is the pipeline. Activation becomes critical when user engagement directly drives revenue without sales intervention.
What are our metrics
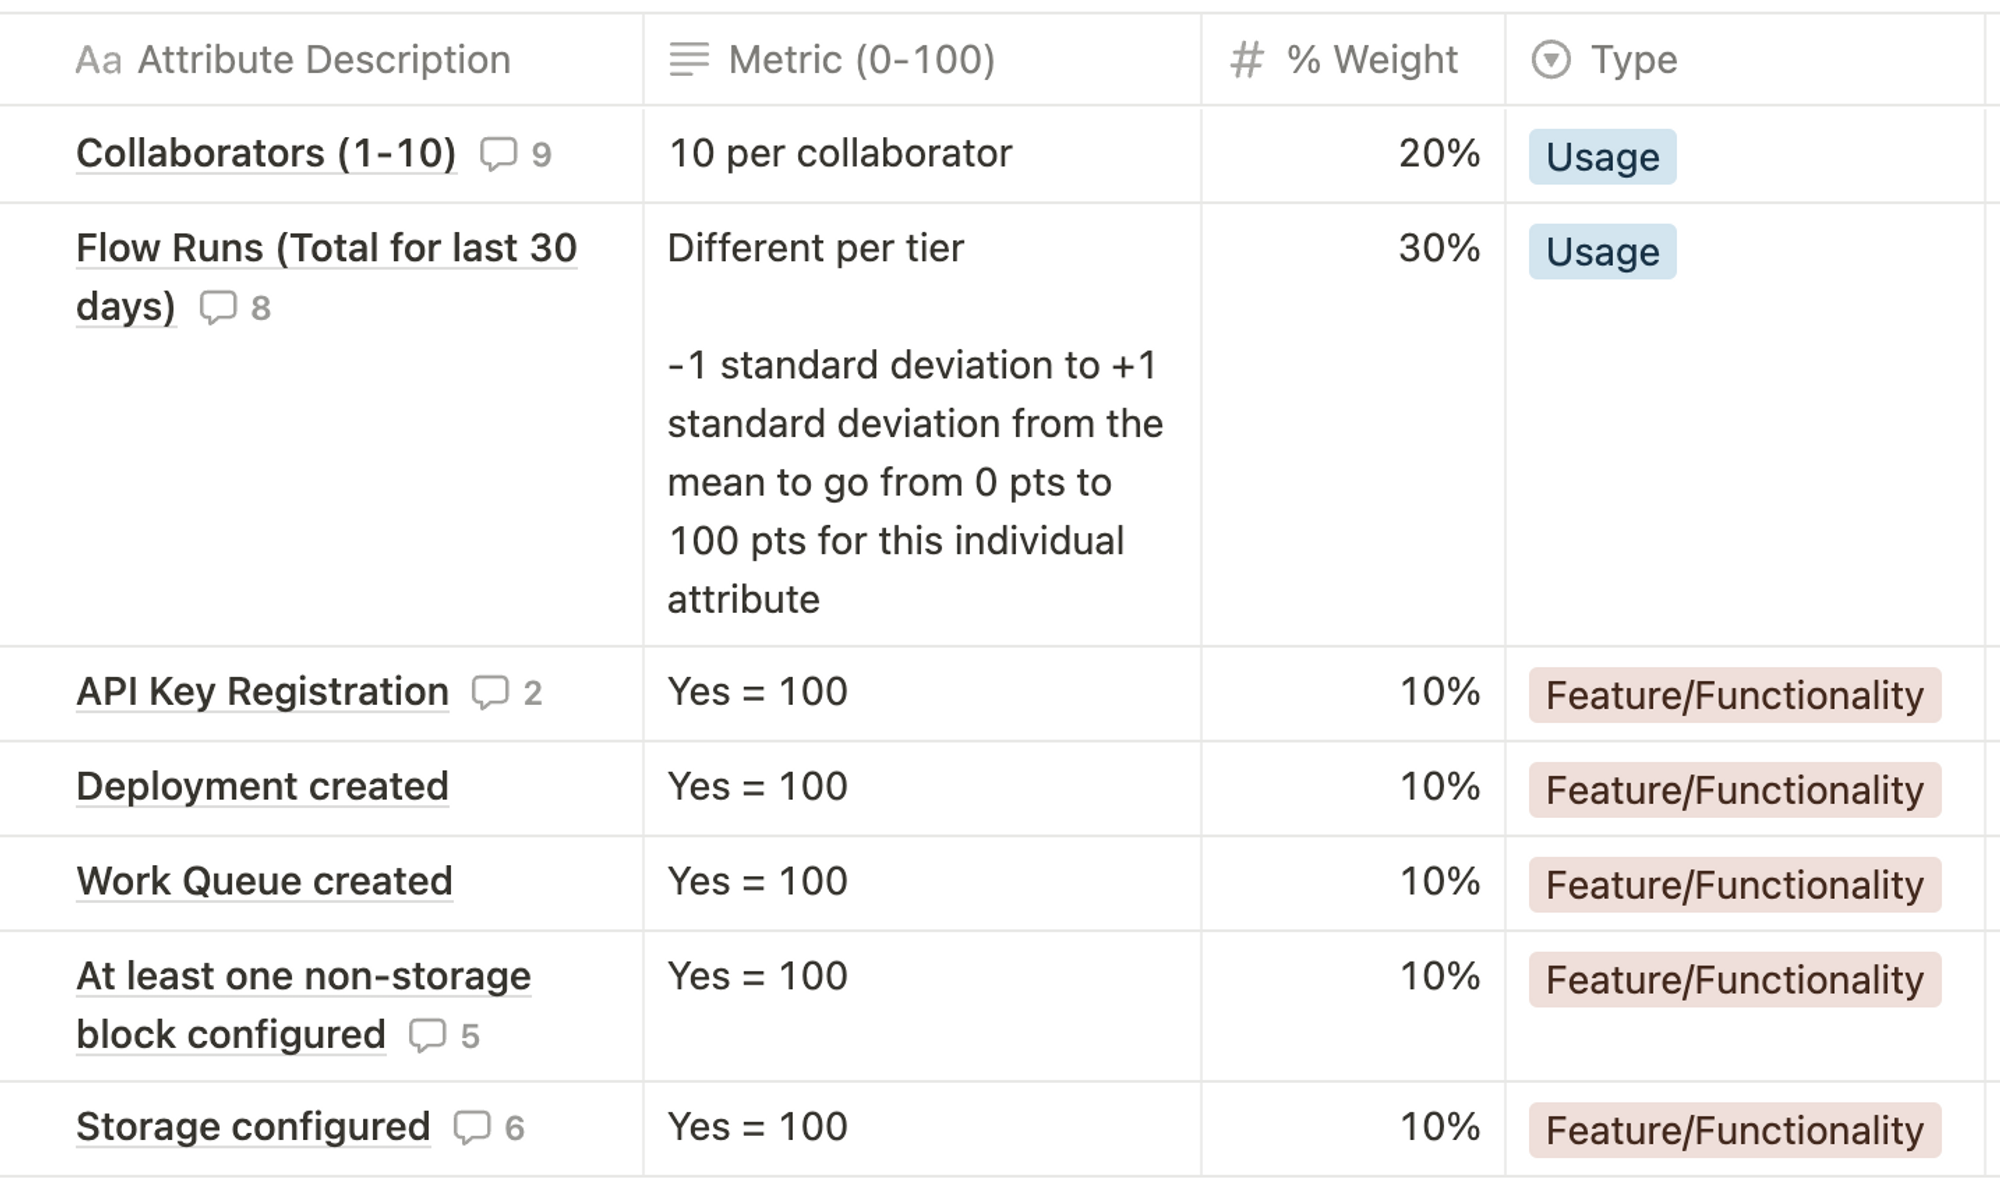
Prefect maintains three activation metrics representing different abstractions: workspaces, users, and accounts. These weighted averages produce composite scores between 0-100, allocating 50% to usage and 50% to feature milestones aligned with the Prefect Growth Framework.
But Chris, this is so complicated
I acknowledge the complexity but argue it achieves its purpose: giving product advocates, salespeople, our support team a quick idea of how far along a user/workspace/account is. The choice between simple and complex metrics depends on organizational context, timing, and goals.
How we made them
Cloud 1 & Pairwise Matrix
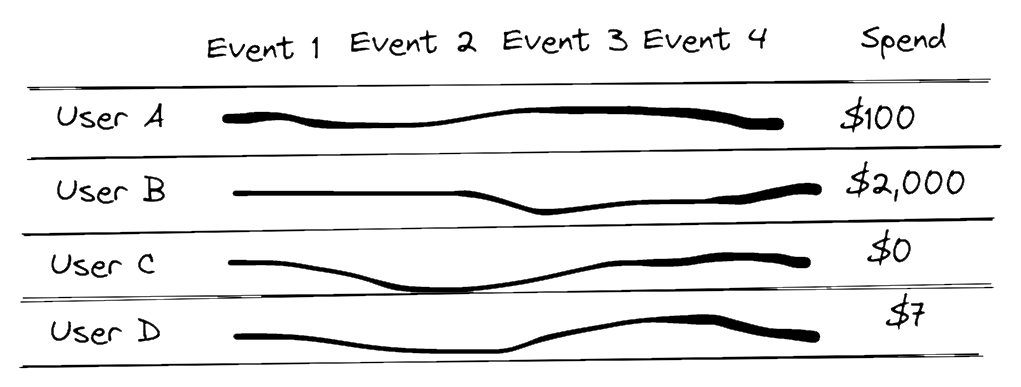
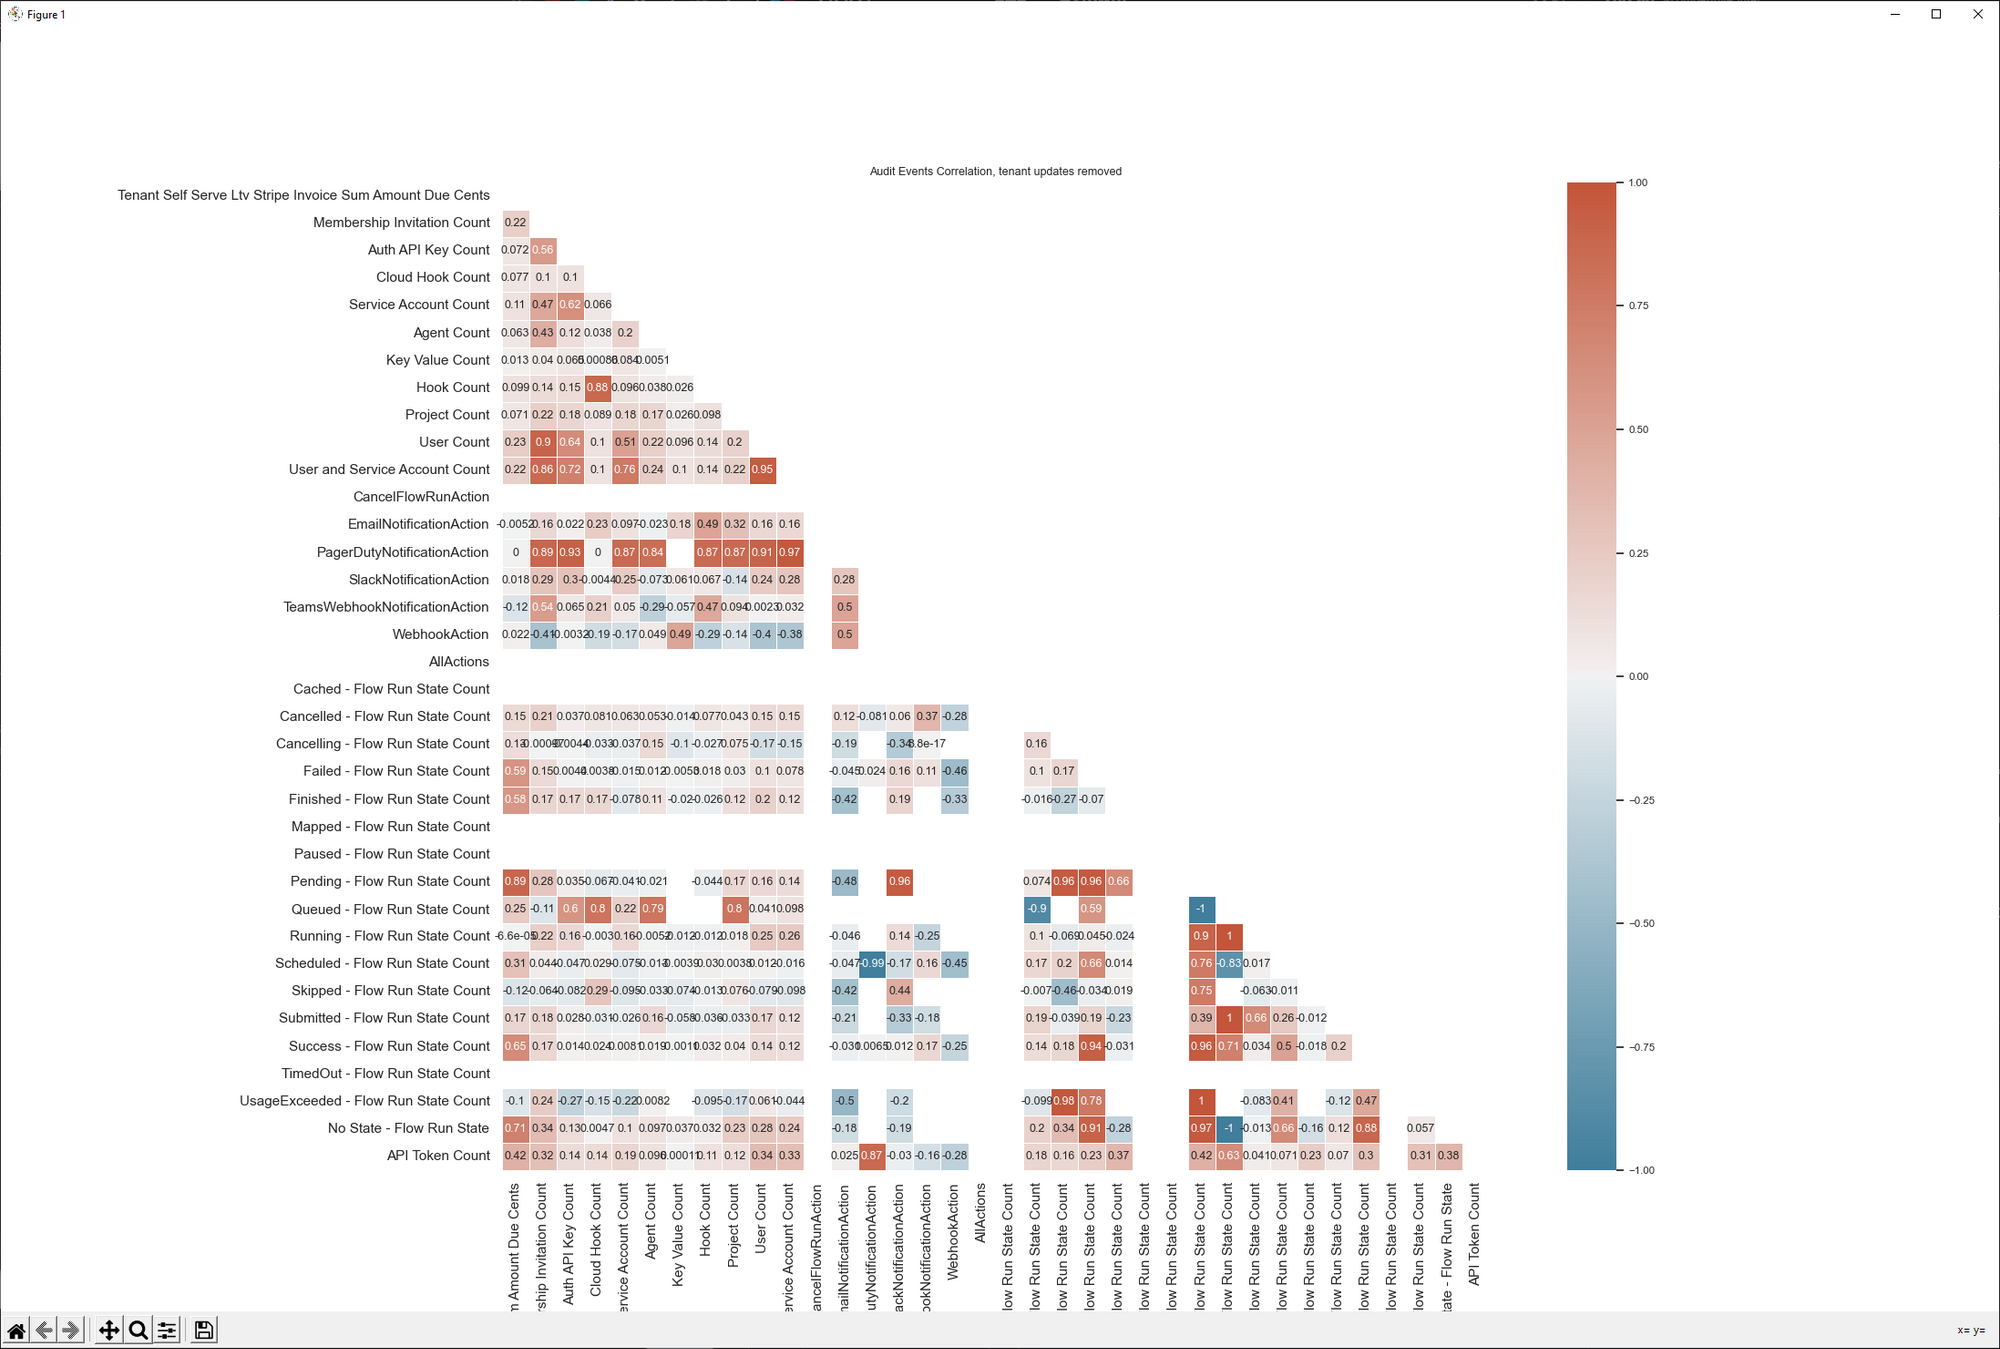
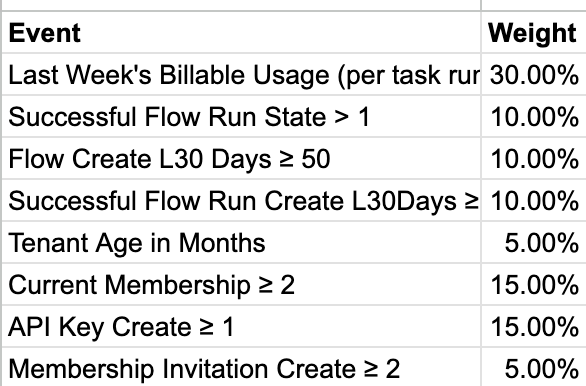
The initial metric used correlation analysis. We created a pairwise correlation matrix examining relationships between user events and lifetime spending, using Python’s pandas .corr() and Seaborn’s heatmap functionality. We identified high-correlation features and worked backward to assign weights.
Cloud 2 & the move to 3 scores
When introducing new abstractions (deployments, work queues), we created three new metrics following the original’s format, though without the direct spend optimization target.
How we use them
Activation scores are calculated nightly using Prefect and dbt, stored in BigQuery, and distributed via Census to multiple platforms:
Individual metrics:
- customer.io (powering onboarding workflows)
- Orbit (community data management)
- Salesforce (augmenting leads and contacts)
Aggregate analysis: We conduct product experiments — UI mockups, in-product tours, feature additions — measuring cohort activation score impacts relative to control groups.
Some lessons learned
1. Persistence and utility drive adoption
Initial adoption was slow. However, consistently offering activation scores when teams needed user progress snapshots gradually built acceptance. If it is helpful, it will be adopted.
2. Operational value beyond analytics
Creating a complex metric forced the team to maintain detailed subcomponents with unexpected benefits — these powered email onboarding workflows, proving activation data has operational applications beyond analytics experiments.
3. Embrace evolution
Activation metrics function as slowly changing dimensions. As products and user behavior evolve, metrics should too. I wouldn’t hesitate to redefine the metric as market conditions shift.